@aliencoder are you aware of the memory usage issue on go-zenon? We were discussing w/ Kaine this week. The znnd process consumes more and more memory until it fails. The process then restarts.
Kaine asked which version we are building znnd with. The znn-controller uses 1.18. He said we need to use 1.19.4.
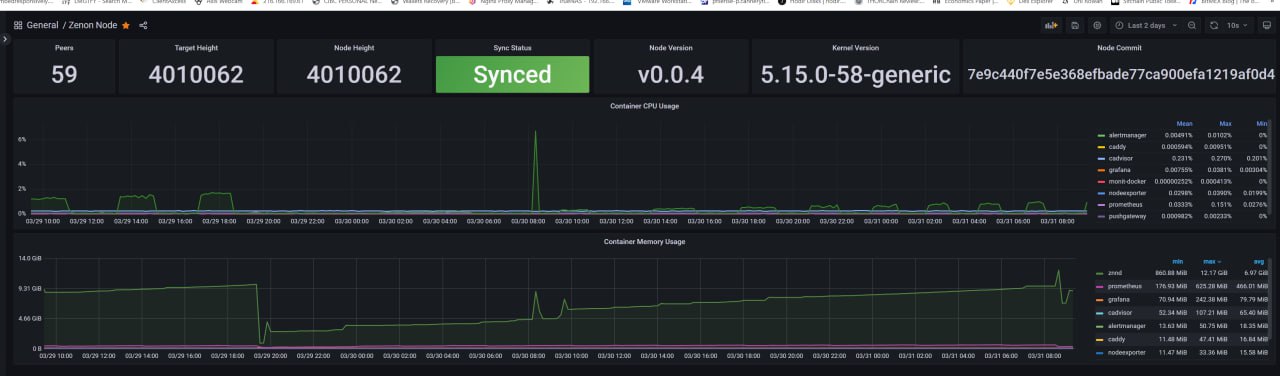
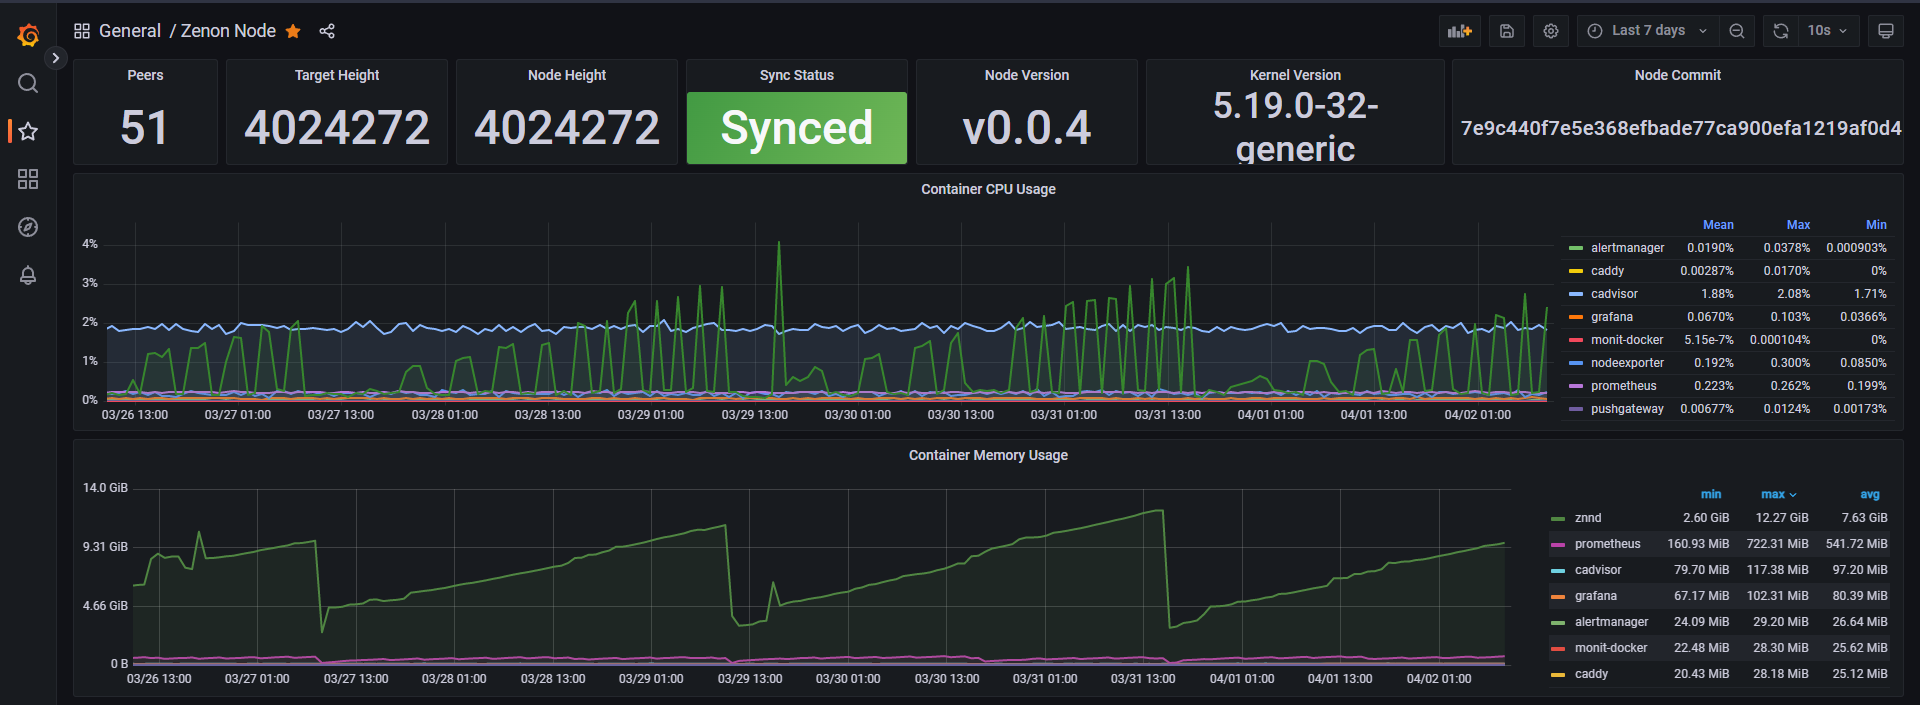
I tried that and it did not fix the issue. You can see the memory usage of znnd over the last 48 hours. It climbs steadily. I have about 8 different nodes that ALL exhibit this same behavior. All the community members have this issue too. Many run a cron job to restart the znnd process every day.
The image might be difficult to see. The bottom line is the znnd process usage. It rises to 85% and then restarts. I have monit monitor the process to automatically restart it. It restarts about every 48 hours.
No, I’m not aware. I’ll try to finish first with the PR stuff and after that explore the go-zenon codebase in more detail. I think first we need a cicd pipeline to be able to build and test automatically znnd
http://127.0.0.1:8848/debug/pprof/  # Main Interface

http://127.0.0.1:8848/debug/pprof/allocs     # Sampling of all past memory allocations
http://127.0.0.1:8848/debug/pprof/block      # Stack tracing leading to synchronous blocking
http://127.0.0.1:8848/debug/pprof/cmdline    # The full call path to the command line of the current program
http://127.0.0.1:8848/debug/pprof/goroutine  # Stack trace for all current Goroutines
http://127.0.0.1:8848/debug/pprof/heap       # Sampling of memory allocation for active objects
http://127.0.0.1:8848/debug/pprof/mutex      # Stack trace for contending mutex lock holders
http://127.0.0.1:8848/debug/pprof/profile    # CPU Configuration File
http://127.0.0.1:8848/debug/pprof/threadcreate # Creating a stack trace for a new OS thread
http://127.0.0.1:8848/debug/pprof/trace      # Tracking of current program execution